

Dashboard
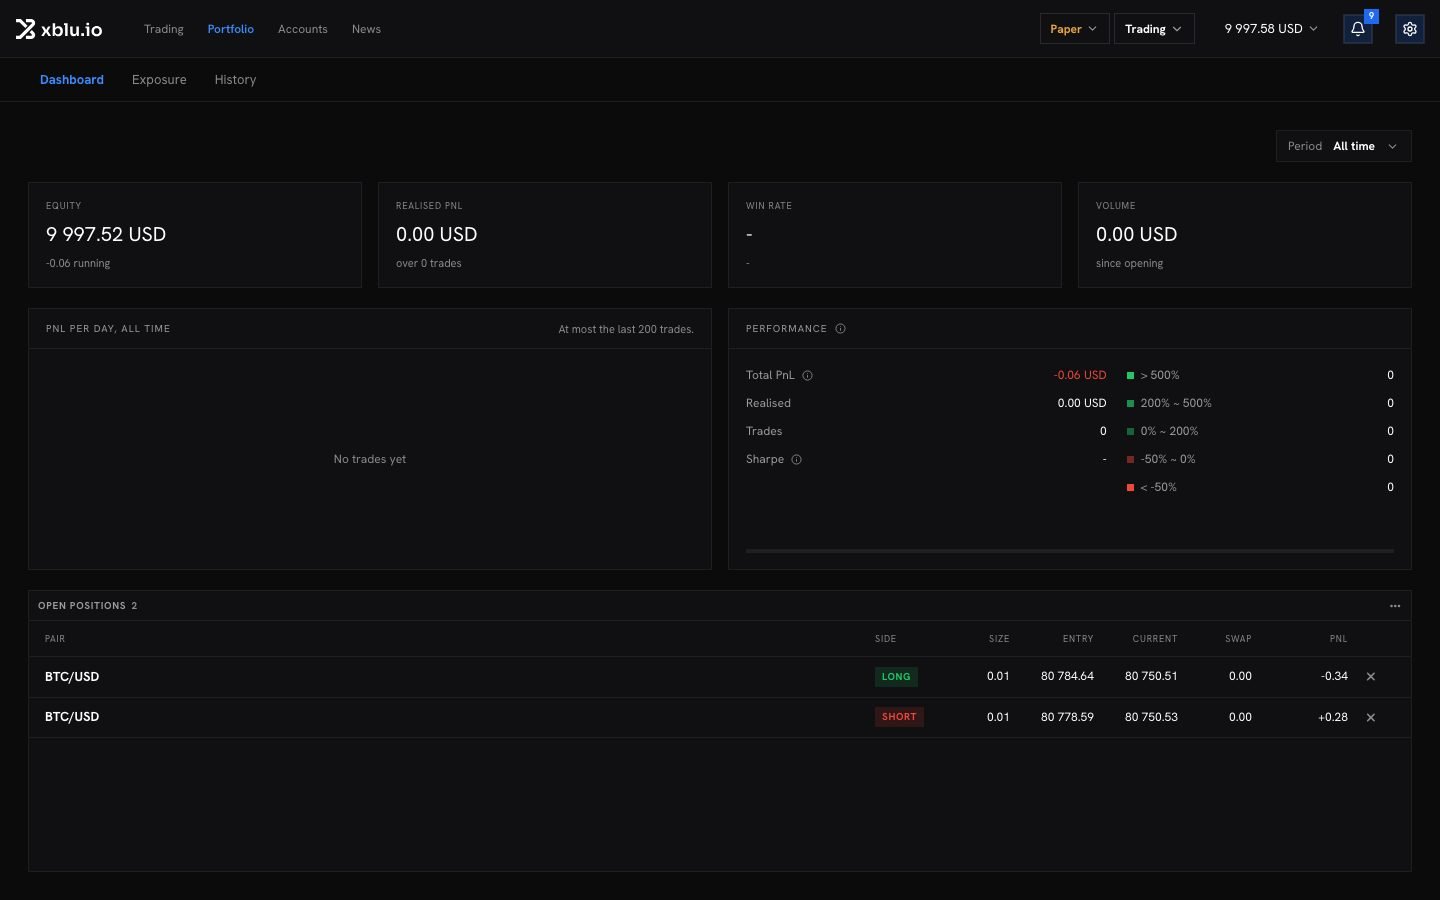
- Total PnL: what the positions closed in the period realised, plus what the positions still open have realised and are running now.
- The PnL per day, as a chart.
- How many positions closed in profit and at a loss.
- The Sharpe ratio, once the period holds enough days with a close.
- Your Open positions.
Exposure
Exposure sums up the equity and the open positions of all your live, or all your paper, trading accounts. Each account shows its margin level. If accounts are kept in more than one currency, they are not added up without a conversion.History
History lists your closed positions: entry, exit, swap, realised PnL and how each one closed. Filter by Period, Outcome and instrument, and click Export to download the list.Statements and documents
Statements and documents holds, per account:- Proof of account opening.
- QUARTERLY STATEMENTS, from January to March, April to June, July to September and October to December. Each one lists every movement and what it was worth when it happened.
- The yearly tax summary, available each January.